
TEA & AECOM Release 2016 Theme Park & Museum Index

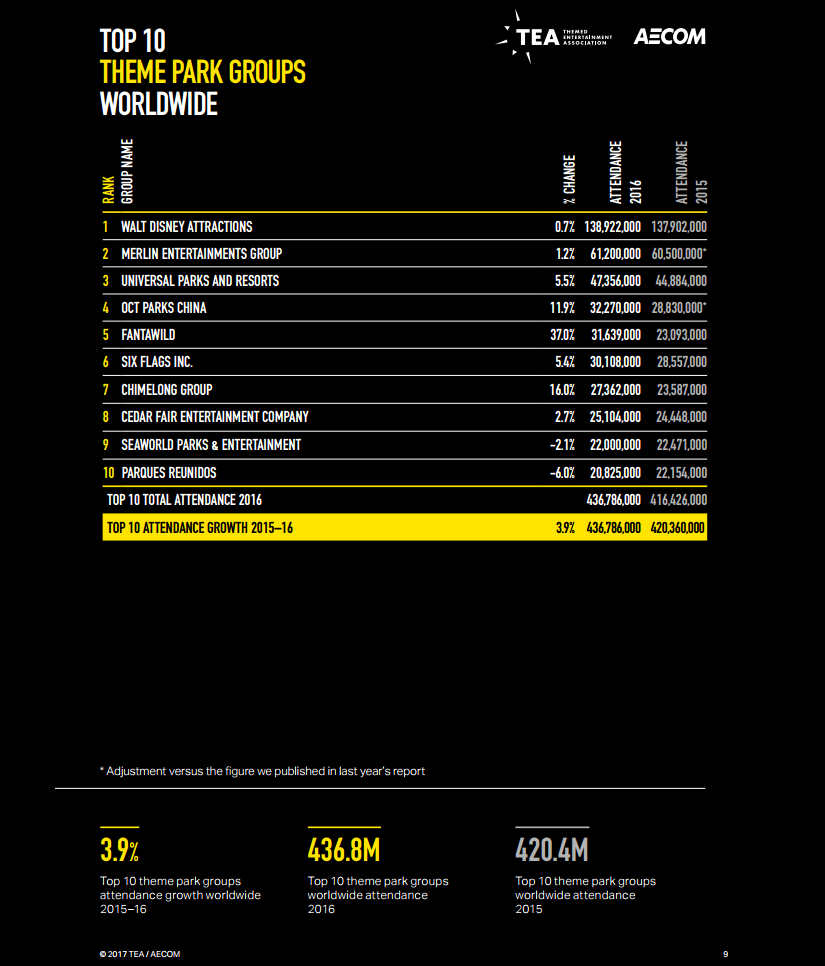
The 2016 Theme Index & Museum Index, an annual study of attendance at top theme parks, water parks and museums around the world, reveals mixed results for calendar year 2016. While attendance at the top 25 theme parks fell by 1.1%, the world’s top 10 theme park operators saw a 3.9% increase at their properties, from 420 million to 437 million visitors. The report also shows attendance at the top 20 water parks worldwide grew by 3.6%, and attendance at the world’s top 20 museums increased by 1.2%.
“Following record setting numbers in 2015, attendance results in 2016 were more modest but still reflective of a healthy, growing industry,” said John Robinett, senior vice president, Economics, AECOM. “The major theme park operators continued their positive performance, and most markets saw slow, steady growth, while weather, tourism and political issues contributed to minor declines in others.”
The report suggests the slight overall decline in attendance at the top 25 theme parks was driven largely by anomalies in Asia. In some areas, revenues grew even where attendance did not – notably at Disney parks in North America. The study reveals an evolving theme park industry with many new ventures and developing markets, offset by well-established operators who continue to refine and improve ways of doing business.

Globally, water parks continued their strong growth trend (attendance increases of 3.6 percent at the top 20), with existing parks doing well and new parks being built. The top 20 museums hit a new high this year of 108 million attendees, exceeding the previous record by over one million guests. The modest growth (1.2 percent) is generally attributed to a dearth of blockbuster exhibition openings in 2016.
“The TEA/AECOM Theme Index and Museum Index is a vital resource, providing our industry with a solid body of relevant research and expertise for more than a decade,” said TEA International Board President David Willrich of DJ Willrich Ltd. “In addition to benefiting the attractions industry, the Theme Index is a boon to tourism, travel, finance, business and education sectors. We’re proud of our partnership with AECOM and our joint efforts to document and understand worldwide attendance trends.”
Here are some key figures from the report:
- 437 million visits to attractions run by the top 10 global theme park groups, up 3.9 percent
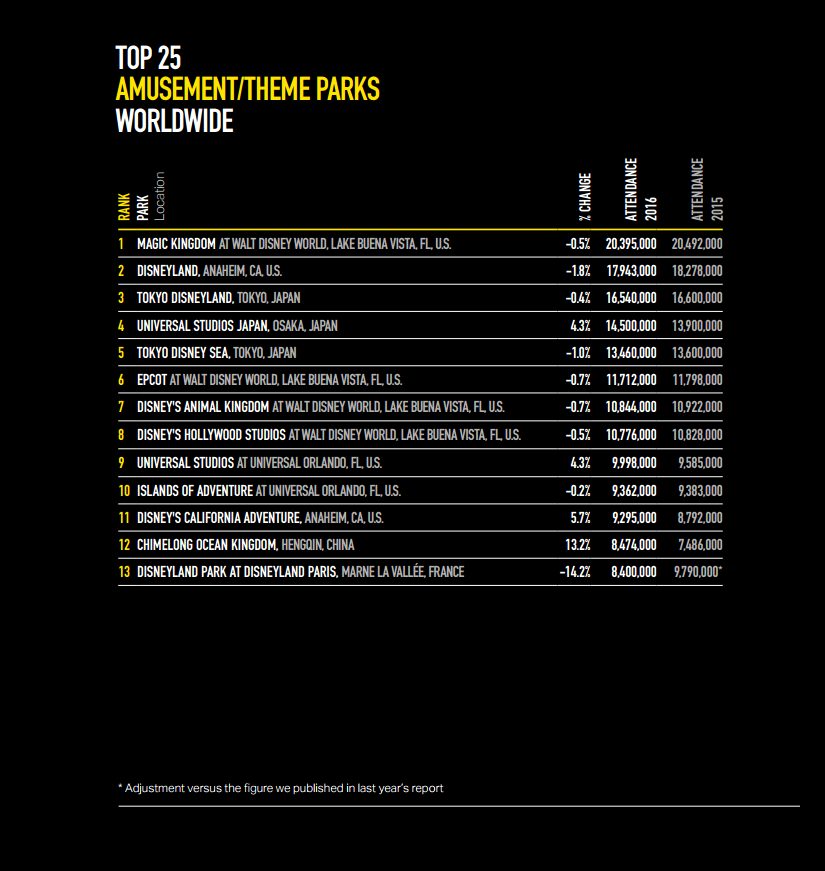
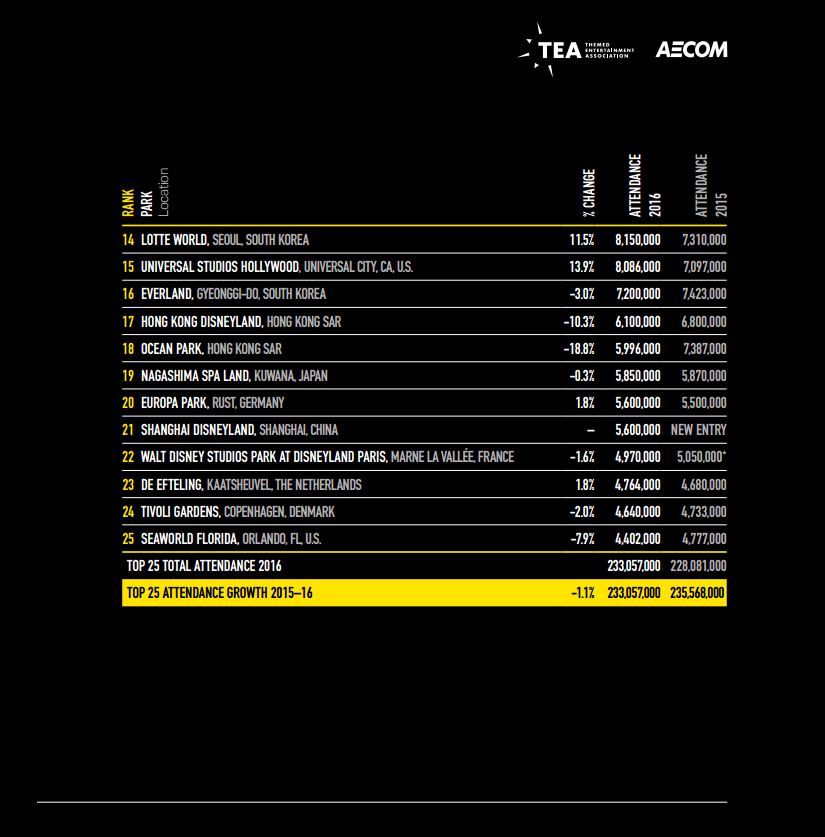
- 233 million visits to the top 25 amusement/theme parks worldwide, down 1.1 percent
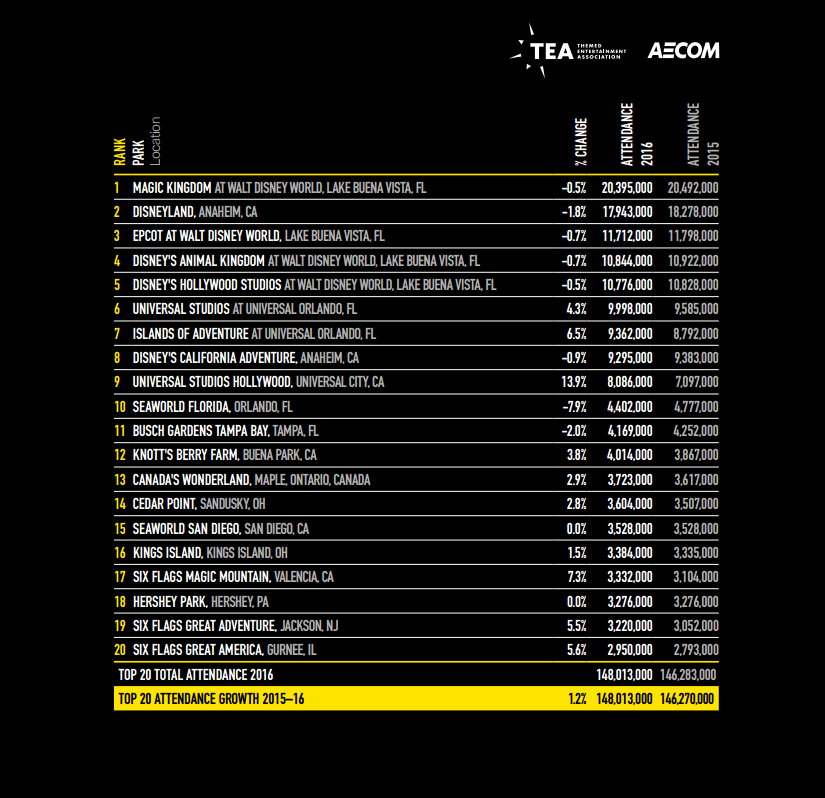
- 148 million visits to the top 20 amusement/theme parks in North America, up 1.2 percent
- 127 million visits to the top 20 amusement/theme parks in Asia-Pacific, down 2.8 percent
- 108 million visits to the top 20 museums worldwide, up 1.2 percent
- 75 million visits to the top 20 museums in Europe, Middle East and Africa, up 0.9 percent
- 60 million visits to the top 20 amusement/theme parks in Europe, Middle East and Africa, down 1.1 percent
- 59 million visits to the top 20 museums in Asia-Pacific, up 3.1 percent
- 58 million visits to the top 20 museums in North America, up 1.8 percent
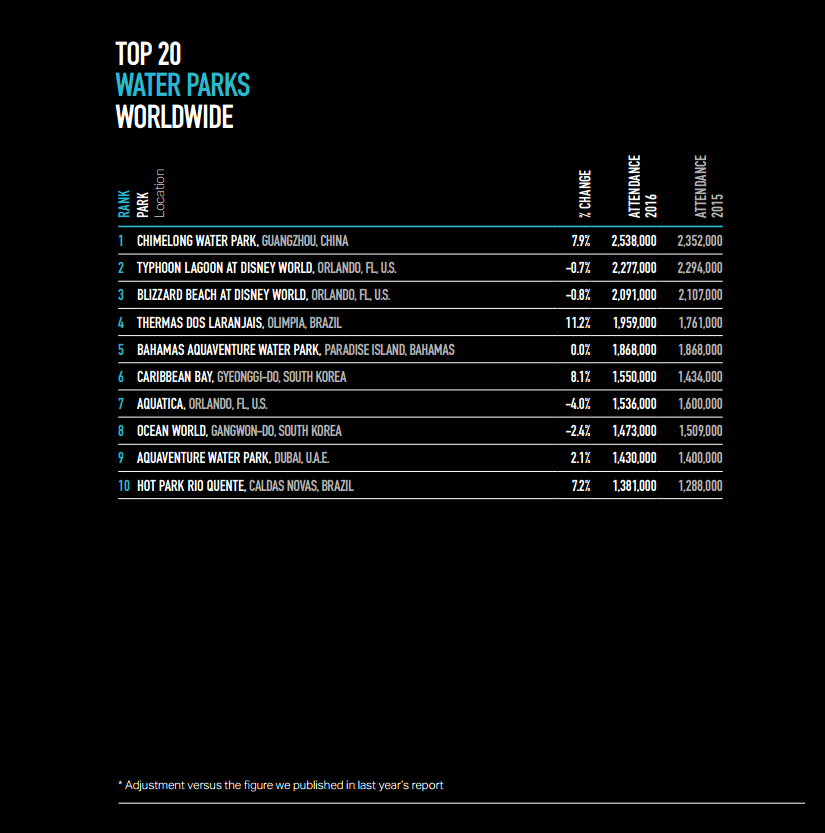
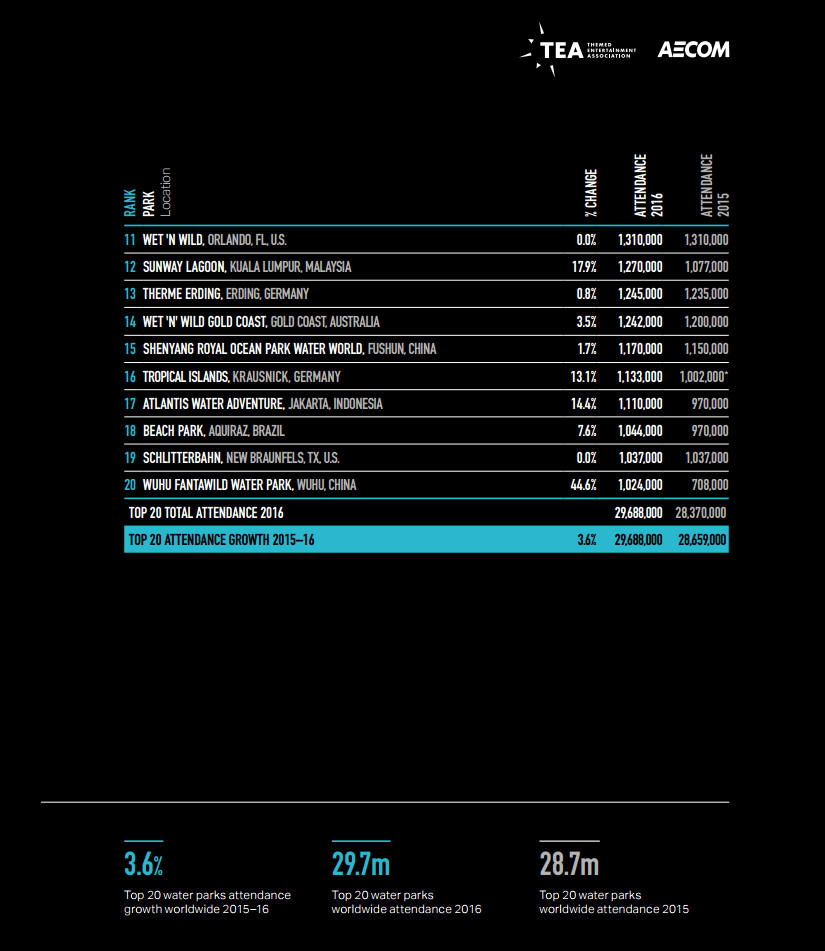
- 30 million visits to the top 20 water parks worldwide, up 3.6 percent
TOP 10 THEME PARK GROUPS WORLDWIDE:
TOP 25 THEME PARKS WORLDWIDE:
TOP 20 THEME PARKS IN NORTH AMERICA:
TOP 20 WATER PARKS WORLDWIDE:
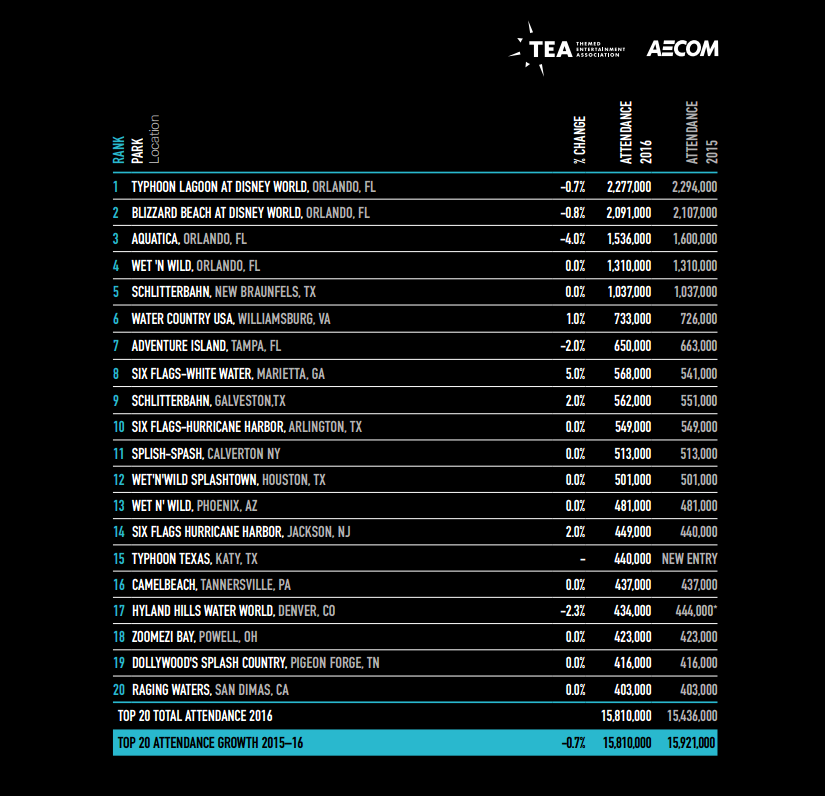
TOP 20 WATER PARKS IN NORTH AMERICA:
TOP 25 THEME PARKS WORLDWIDE:
TOP 20 THEME PARKS IN NORTH AMERICA:
TOP 20 WATER PARKS WORLDWIDE:
TOP 20 WATER PARKS IN NORTH AMERICA:
The attendance study is created and distributed by the Themed Entertainment Association (TEA) and the economics practice at AECOM. The new study and prior editions (dating to 2006) are now available online at http://www.teaconnect.org/Resources/Theme-Index/ and http://www.aecom.com/themeindex.


Post a Comment